2026 Best Micro Inverter Solar Systems for Buyers
Choosing among the 2026 best micro inverter solar systems means looking beyond headline efficiency. Microinverters convert a panel’s direct-current output into alternating current at the module, which can help systems handle partial shade and varied roof angles. But panel-level conversion does not automatically make every installation better. Roof layout, equipment compatibility, warranty terms, and local installer support still matter.
The market is expanding quickly. SEIA and Wood Mackenzie reported that the United States installed a record 50 gigawatts of solar capacity in 2024. That growth gives buyers more equipment choices, but it also makes careful comparisons essential. NREL researchers Dirk Jordan and Sarah Kurtz reviewed photovoltaic performance data and reported, “The median degradation rate is 0.5%/year.” That figure describes panels, not microinverters; the distinction matters when estimating long-term system output.
Small details count. Ask whether monitoring identifies individual panel faults, whether the inverter works with your planned battery, and who handles warranty service. Compare total installed cost, not just equipment prices. A shaded chimney can change the value of panel-level electronics; a clear, uniform roof may change it less. No single configuration suits every home. And specifications alone cannot predict installer quality.
This guide compares leading micro inverter solar systems for buyers, focusing on conversion performance, monitoring, warranties, system compatibility, and practical ownership considerations. Use the evidence as a starting point, then verify current product terms and obtain site-specific quotes. Choices can be imperfect. A careful comparison still beats a confident guess.
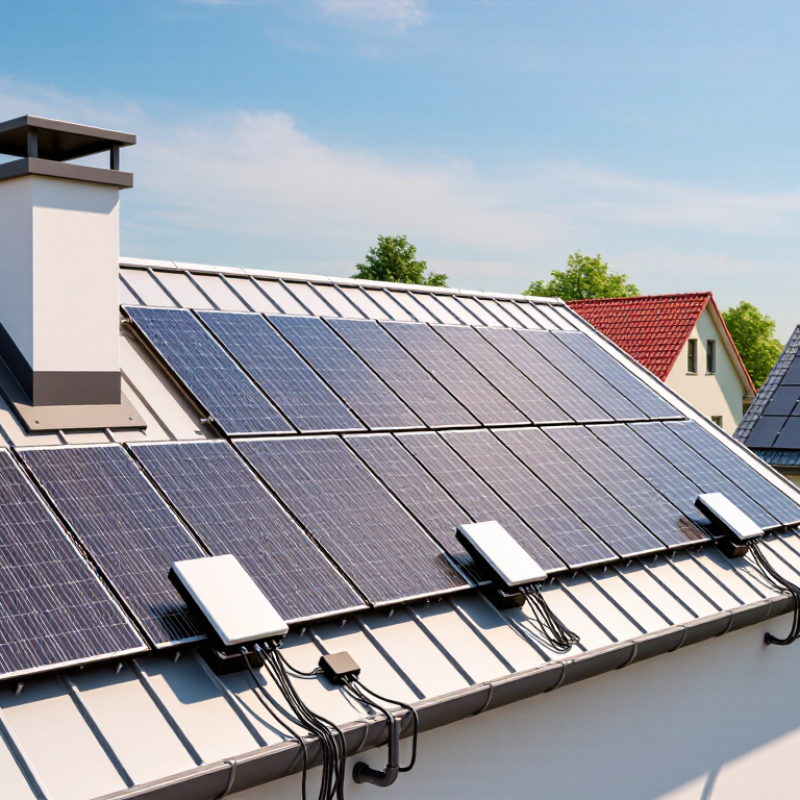
How Microinverters Convert Each Solar Module’s DC Power into AC
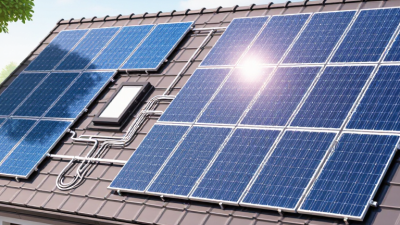
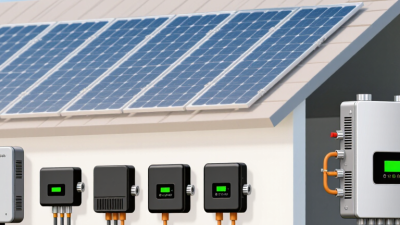
A solar module produces direct-current (DC) electricity, while household circuits generally use alternating current (AC). A microinverter performs this conversion at the module, often from a compact unit mounted beneath the panel. Its power electronics switch and shape the incoming current into AC with the voltage and frequency needed for the system. That is the idea.
Because each module has its own inverter, it can usually track its own best operating point as sunlight changes. A passing cloud may shade one panel while nearby panels remain bright. With module-level conversion, that shaded panel is less likely to limit the output of the entire string. Small, but important. Actual results still depend on panel placement, temperature, wiring, and equipment limits.
The inverters feed AC into branch wiring, which connects to the home’s electrical system. Their monitoring data can help an installer spot a module producing less than expected, though readings do not explain every fault by themselves. Grid-connected units also stop exporting power during an outage unless the system includes suitable backup equipment. Buyers should compare rated output, operating temperature range, monitoring details, and service access. The tidy rooftop diagram can make installation look effortless; cable routing and future replacement deserve equal attention.
Match 300–500 VA Microinverters to Module Output and Expected Clipping
A 400 W module paired with a 300 VA microinverter has a DC-to-AC ratio near 1.33, while a 500 VA unit brings it to about 0.80. These are screening figures, not annual energy forecasts: VA and usable real-power ratings may differ. Check the inverter’s continuous AC rating, then compare it with the module’s STC output. NREL’s PVWatts documentation uses a 1.2 DC-to-AC ratio as a modeling default and accounts for clipping. That is a reference point, not a rule for every roof.
Clipping occurs when strong sunlight pushes module output above the inverter’s AC limit. A south-facing roof in clear weather may clip more often than a shaded or east-west array. Small amounts can be acceptable if a higher-capacity inverter costs more than the extra energy is worth. Still, estimate annual clipping with hourly production data for the site; a midday peak alone can exaggerate the loss. Sandia’s Photovoltaic Array Performance Model also accounts for operating conditions that affect output, including temperature. In practice, a hot module on a roof can produce less than its STC rating. It’s easy to overfocus on the wattage label. Compare expected annual energy, inverter limits, and price together—and revisit the assumptions if the roof orientation is uncertain.
Compare CEC-Weighted Efficiency Near 96%—Not Peak Efficiency Alone
When comparing 2026 microinverter solar systems, look beyond the highest efficiency figure on the product sheet. Peak efficiency describes performance under favorable conditions, often at a specific power level. CEC-weighted efficiency reflects performance across a range of operating loads. That makes it a more practical comparison for a system that rarely operates at one perfect output. Near 96% is a useful benchmark, not a guarantee for every model or installation.
Check that competing figures use the same rating method. A small percentage difference may matter over years of production, but roof orientation, shade, and local weather also shape energy yield. On a roof with morning shade, panel-level conversion can help limit the impact on neighboring modules. Still, it cannot erase lost sunlight. Look closer.
Review the datasheet’s operating range, warranty terms, and monitoring details alongside efficiency. Clear module-level data can help an owner spot an underperforming panel, though readings may not explain the cause. I would not choose a system on one number alone; that is an easy mistake to make. Ask for estimated annual production based on the actual roof, then compare assumptions across proposals. Near 96% sounds precise, but real-world results depend on the whole installation.
Check 240 V Grid Compatibility, Rapid Shutdown, and Monitoring Features
When comparing 2026 microinverter solar systems, check the exact grid configuration before comparing efficiency claims. Many homes use 240 V split-phase service, but equipment must match the site’s voltage, frequency, and approved connection method. Ask a qualified installer to confirm compatibility at the service panel, not just from a product chart. Small details matter.
Rapid shutdown is another practical check. Confirm that the complete system, including its shutdown equipment and controls, meets the requirements adopted in your area. Ask what happens when the shutdown switch is used and how responders can verify the system is de-energized. A clear label near the service equipment helps. Test the procedure during commissioning, and keep the instructions accessible. Paperwork can get misplaced.
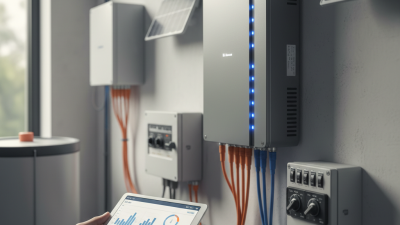
Monitoring quality affects daily ownership. Look for module-level readings that show energy production, faults, and communication status, with timestamps you can understand. Check whether the system stores data during an internet outage and how it reports missing connections. A panel that shows one low-producing module can help identify shade, debris, or a loose connection, but readings do not replace an on-site inspection. Also review account access and alert settings. Some dashboards feel cluttered, and alerts may arrive late; that is worth asking about before installation.
Compare 12–25-Year Warranties, Service Terms, and Lifetime Cost per Watt
Microinverter warranties commonly range from 12 to 25 years, but the headline term is only one part of the comparison. Check whether coverage includes replacement labor, shipping, diagnostics, and removal of failed units. Some terms cover the device but leave roof access or electrician costs to the owner. Read the exclusions. Confirm whether claims require installer records or ongoing system monitoring, and whether replacement equipment receives a fresh warranty. These details can matter when an inverter fails on a steep roof, far from the original installer.
Compare lifetime cost per watt, not just the purchase price. Divide equipment, installation, expected service, and replacement costs by the system’s DC watts. For example, a $0.10-per-watt premium equals $0.004 per watt annually over 25 years, before financing or repairs. That is a useful threshold, not a forecast. NREL’s review of photovoltaic degradation found a median module degradation rate near 0.5% per year, reminding buyers that system output changes over time. Modules and inverters age differently, so that figure does not predict inverter failure. Ask for written labor rates and replacement procedures, then model at least one paid service visit. A long warranty may still leave inconvenient gaps. And local installer support can disappear before the warranty does.
2026 Best Micro Inverter Solar Systems for Buyers
Illustrative comparison of warranty-term examples and modeled 25-year lifetime cost per watt. No company or brand data is shown.
Warranty terms of 12, 15, 20, and 25 years are examples found in the market, not claims about particular products. The cost line is a transparent scenario, not a market quote: it assumes an initial system cost of $3.00/W and a service reserve of $0.02/W per year after the warranty term, through year 25. Actual coverage, labor, shipping, exclusions, and service response vary; compare the written warranty and obtain project-specific quotes.